Memory leaks: Determine an application's CPU consumption
The same symptoms for a memory leak can be caused by a poorly written application that consumes an excessive amount of CPU time. Here's how to determine how much CPU time an individual application is using.

One of the most common symptoms of a memory leak is that as time goes on, the computer runs slower and slower. Its speed is restored with a reboot, but it soons begin degrading again.
However, a memory leak is not the only condition that can cause these symptoms. They can also be caused by malware or by a poorly written application that consumes an excessive amount of CPU time. How can you tell how much CPU time an application is consuming, and whether that CPU consumption is a problem?
Determining application CPU usage
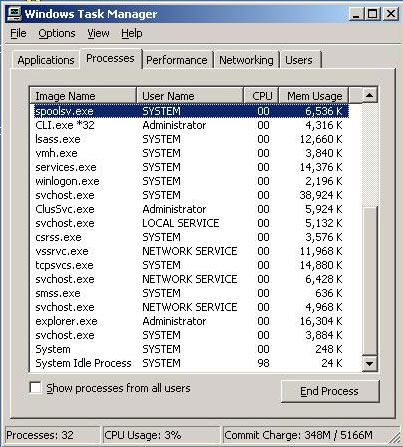
Determining how much CPU time an individual application is using is simple. Just press CTRL+ALT+Delete, then click the Task Manager button. When Task Manager opens, the Applications tab will display a list of all the applications running on the server.
Windows won't actually display the amount of CPU time that an individual application is using. This is because Windows looks at the amount of system resources consumed by a process rather than an application. An application is made up of one or more processes. To see how much CPU time a process is using, select the Process tab.
The bottom of the screen below shows the total number of processes running on the machine at the given moment, along with the total percentage of CPU resources in use. The main part of the screen displays each individual process along with the percentage of CPU time the process is currently consuming. This screen displays both system processes and processes related to user-mode applications. The last process listed is the System Idle Process, which isn't a process at all; it refers to how much of the CPU's processing power is going unused at the current moment.
Any one of these processes (with the possible exception of the System Idle process) can momentarily consume all of the system's processing power (100% CPU utilization). However, this does not necessarily indicate a problem. The only way to really find out whether a process is consuming an excessive amount of CPU time is to watch the process over time, and look at the average amount of CPU time it's using.
Tracking CPU usage across systems
Windows' Performance Monitor is not designed to track the CPU usage of individual processes, but it can track CPU usage across the entire system. The Processor\%ProcessorTime counter displays the current CPU usage similar to the way Task Manager does. The difference? This counter allows you to view average CPU consumption in addition to current CPU consumption.
|
|||||||||||||||||
If average CPU consumption is consistently above 80%, that's usually a problem. But looking at average CPU utilization isn't enough. To determine if a process is having a detrimental effect on the CPU, you must know how the CPU is being used.
In some cases high processor utilization means that your system is struggling to keep up. In other situations, the CPU might have a high utilization value, but is actually working very efficiently. In these situations, a high utilization value is often caused by an access number of interrupts. Interrupts occur when drivers or operating system subcomponents need to access other hardware components, such as the hard disk.
Performance Monitor counters
There are several CPU-related Performance Monitor counters that you can watch to get a better idea of what's going on with your server's CPU. The System/Processor Queue Length counter displays the number of items that are waiting for the CPU to become available. If this queue regularly exceeds two items, the CPU is not performing adequately.
As I mentioned earlier, interrupts caused by hardware devices that need to access the CPU. The Processor/Interrupts/Second counter allows you to watch how many processor interrupts occur each second. The number of interrupts per second that are considered normal varies from server to server.
But if a hardware device is getting ready to fail, it will often generate an excessive number of interrupts. If the number of processor interrupts per second seems high compared to your other servers, and there does not appear to be enough activity to justify the spike it interrupts (such as disk access), it could be a sign that a hardware component is failing.
The Processor/% Interrupt Time counter shows you what percentage of time the CPU spends servicing hardware interrupts. Again, watch for spikes in an interrupt activity without a corresponding increase in system activity.
Of course our goal is to determine whether the amount of CPU time spent on a particular process is healthy. The Processor/% User Time counter shows the percentage of time the processor spends on user mode applications. Note: This counter only looks at non-idle CPU time. If this value is consistently high, it doesn't necesarily mean your CPU is being overworked; it simply indicates that a disproportionate amount of the CPU's resources are being spent on user mode processes as opposed to kernel mode processes or interrupts.
The Processor/% Privileged Time counter shows the percentage of non-idle CPU time being spent on kernel mode processes. If this value is disproportionately high, it either means that the user mode applications running on your server are not consuming much CPU resources, or that excessive interrupts are occurring and that a hardware component might be getting ready to fail.
Improving the CPU's performance
It's okay for an application to have disproportionately high CPU utilization so long as the system's CPU utilization as a whole is not consistently above 80%. If that's the case, you need to find out why. If you determine that the excessive CPU usage is related to the applications running on the server, it may be necessary to either upgrade the processor or to move some applications to a different server. Another option is to use processor affinity to assign each application to a specific processor.
Note: Applications with memory leaks can cause the CPU to work excessively. As a system's available RAM decreases, the system relies increasingly on the pagefile. The more heavily the pagefile is used, the more time is spent swapping pages between physical and virtual memory.
This page-swapping process consumes both CPU time and disk time (which also consumes CPU time in the form of interrupts). If your system seems to the paging excessively, look for applications with memory leaks and correct them. If no memory leaks exist, try increasing the amount of RAM installed in the server. Doing so will often improve the CPU's performance.
![]()
![]() How to detect a memory leak in Microsoft Windows
How to detect a memory leak in Microsoft Windows
![]()
![]() Introduction
Introduction
![]() Memory leaks: Finding a memory leak in Microsoft Windows
Memory leaks: Finding a memory leak in Microsoft Windows
![]() Finding memory leaks using Performance Monitor
Finding memory leaks using Performance Monitor
![]() Memory leaks: Determine an applications CPU consumption
Memory leaks: Determine an applications CPU consumption
About the author:
Brien M. Posey, MCSE, is a Microsoft Most Valuable Professional for his work with Windows 2000 Server, Exchange Server and IIS. He has served as CIO for a nationwide chain of hospitals and was once in charge of IT security for Fort Knox. He writes regularly for SearchWinComputing.com and other TechTarget sites.