Perfmon made easy with PAL utility
Performance Monitor in Windows is a great troubleshooting tool, but analyzing logs can be tedious. Learn to use the free PAL utility to take the time out of troubleshooting.
Tackling server performance issues can be a major challenge. Bottlenecks, changing workloads, and disk or network saturation are just a few of the potential performance concerns that can arise. Furthermore, today's client-server applications, multi-node clusters, and distributed infrastructures only magnify the complexity of troubleshooting these issues.
|
||||
Fortunately, there are several tools built right into the Windows operating system that can assist you. For a quick and dirty analysis of potential bottlenecks, you have the Windows Task Manager. The Task Manager, only allows you to monitor the performance interactively, however, without the ability to log any data. This can be lacking if the performance issue is a transient one that could surface when you aren't watching.
Better yet, there is the Performance Monitor utility, or Perfmon. Perfmon allows you to collect performance metrics to a log file which can be subsequently analyzed in detail. You can graph various performance counters illustrating their minimum, maximum and average values across a time range. There is also a handy Microsoft utility called PerfWiz that provides a menu-driven interface to automate the collection of Perfmon data.
The downside to Perfmon is that it provides no assistance when trying to correlate the hundreds of performance counters that exist. It can take hours or days to analyze a set of Perfmon logs to determine which counters are out of tolerance and which ones are interrelated. There are also many tricks to learn about utilizing Perfmon, such as scaling values, adjusting time ranges and analyzing graphs.
PAL to the rescue
Fortunately, there is a free tool developed jointly by Microsoft and the open source community called PAL (Performance Analysis of Logs). This powerful tool is used in conjunction with Perfmon data to automatically analyze the counters for various thresholds. It provides fantastic graphs, correlations and explanations of the metrics that are relevant to the noted performance bottlenecks. The tool has easily saved me hundreds of hours when analyzing performance issues.
There are a few requirements for installing PAL which are thoroughly documented on the CodePlex website. These include the supported operating systems (Windows XP SP2, Windows Vista and Windows Server 2003), the Microsoft Log Parser 2.2 software, Microsoft Office Web Components 2003, and .NET Framework 2.0 for the optional GUI interface. Note that only 32-bit is supported due to the Office Web Components software, though Perfmon data can be collected on any Windows platform.
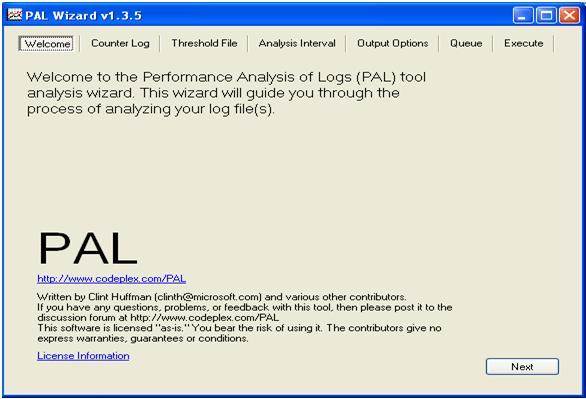
PAL is essentially a VBS script that utilizes the Log Parser software to read the Perfmon log files. With the GUI interface, you are prompted by the PAL wizard for the location of the Perfmon logs, threshold file, analysis interval and report options. By default, an HTML report is produced which can be read by your favorite browser. The latest release of PAL is version 1.3.5 which was made available in June 2009, as seen in the following example:
Figure 1 (Click to enlarge)
Using the PAL utility
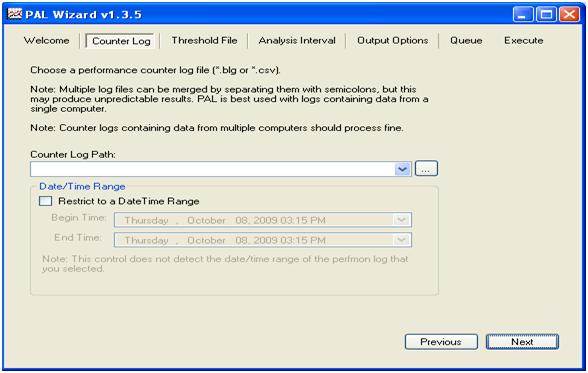
Let's take a look at how simple PAL is to use. The following section will explore the different menu prompts from the wizard. The first tab is used to specify the location of the Perfmon log files. These files can either be in the native Perfmon binary format (.blg log files) or comma-separated values (.csv log files). You can optionally restrict the log data to a specific date time range as seen below. This can be useful if you happen to know when the performance issue is occurring.
Figure 2 (Click to enlarge)
Next, the wizard prompts for the threshold file to be used for comparisons to determine if Perfmon counters have exceeded predetermined values. There are a variety of pre-canned thresholds to choose from, or you have the option to specify your own values. As you can see, you can select thresholds for Exchange Server environments, SQL Server, Internet Information Services (IIS), SharePoint, Active Directory, BizTalk, Hyper-V and System Overviews.
A few brief question variables are also prompted to help PAL understand the server configuration. These include the number of processors, whether the 3 GB switch is being used, if the server is 64-bit, the total physical memory, and whether a kernel dump exists on the C drive.
Figure 3 (Click to enlarge)

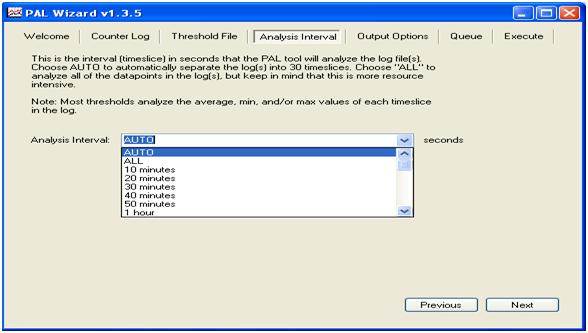
The next tab specifies the analysis interval -- or time slice -- in seconds to be used. You can specify AUTO, which will separate the log into 30 time slices, or ALL, which will analyze all of the data points.
Figure 4 (Click to enlarge)
Finally, the PAL wizard will prompt for the report output options. These include the output directory and output format (either HTML or XML). The remaining two tabs (Queue and Execute) allow you to modify the PAL command and the execution of the job. Be warned that it can take over an hour for the data to be processed depending on how large your Perfmon log files are.
Reviewing PAL reports
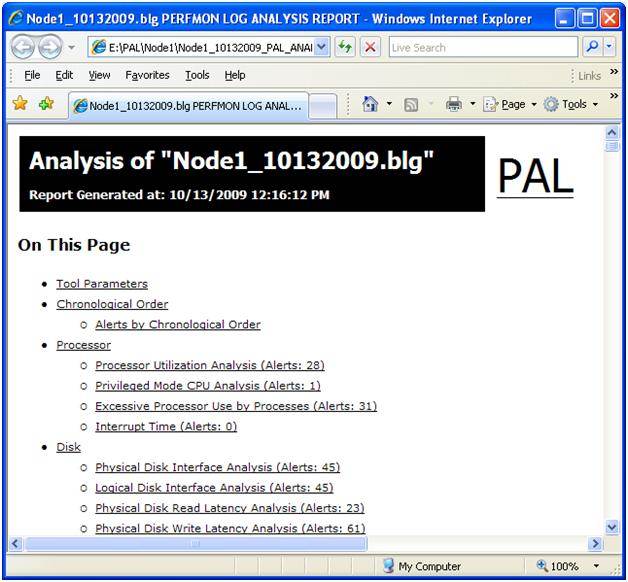
Once the PAL job completes, the tool will generate an HTML report that you can view with your favorite browser. The report is divided into several sections beginning with a summary that contains hyperlinks to the other sections. A chronological listing of events which triggered their respective thresholds is provided, followed by the various performance objects such as processor, disk and memory. An example of the summary section is given below.
Figure 5 (Click to enlarge)
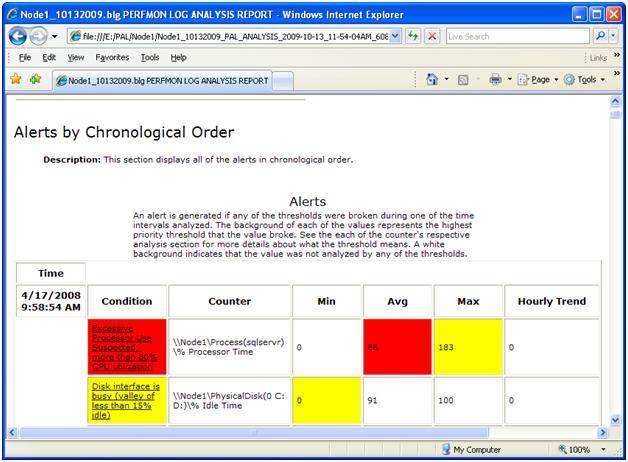
By clicking on the various hyperlinks, you can focus on the particular performance counters that triggered the threshold values. The chronological section highlights the various conditions, color-coding their severity (yellow = warning, red = excessive). You can then drill down on the condition hyperlink, which will take you to the corresponding graph with an explanation of the performance counter and why the threshold was triggered. In Figure 6 we see an example of the Chronological Order section of the report.
Figure 6 (Click to enlarge)
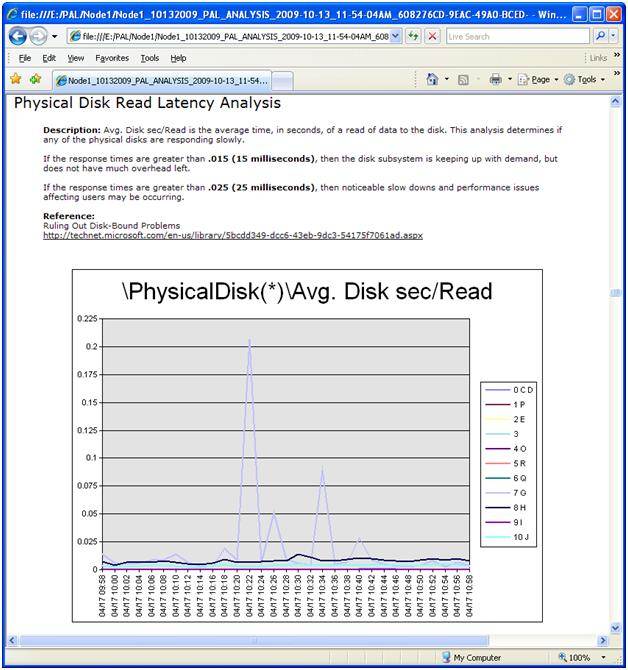
Each of the performance counters is explained in detail, including a description of the counter, why the counter threshold is significant and additional references that can assist you with troubleshooting the issue. In the following example, we see the Physical Disk Read Latency counter and its corresponding explanation, thresholds, additional references and graph. It clearly shows that disk G: is experiencing significant spikes that should be investigated further.
Figure 7 (Click to enlarge)
In conclusion, troubleshooting a performance issue can be a tedious challenge with several hundred potential performance counters to review. Identifying when these counters have exceeded various thresholds, graphing their trends and identifying bottlenecks can be a very time-consuming ordeal. With PAL, however, you can drastically cut down the amount of time required to review the parameters, graph the results and focus on fixing the underlying issues.
ABOUT THE AUTHOR
Bruce Mackenzie-Low, MCSE/MCSA, is a systems software engineer with HP providing third-level worldwide support on Microsoft Windows-based products including Clusters and Crash Dump Analysis. With more than 20 years of computing experience at Digital, Compaq and HP, Bruce is a well known resource for resolving highly complex problems involving clusters, SANs, networking and internals.
Dig Deeper on Microsoft cloud computing and hybrid services
-
![]()
Learn how to set up Windows Server 2022 SMB compression
By: Brien Posey
-
![]()
Infrastructure-as-Code series: Practical monitoring in an IaC universe
By: Adrian Bridgwater
-
![]()
Monitoring thresholds determine IT performance alerts
By: Alastair Cooke
-
![]()
Tips for improving Active Directory performance on servers
By: Stephen Bigelow