SearchWindowsServer.com
Sysinternals RAMMap utility sheds new light on Windows memory usage
By Serdar Yegulalp
Memory management in Windows is one of those topics that confuses a lot of people, including experts.
Here's a random example: Windows pre-populates memory with commonly-used data to reduce the amount of disk I/O. When this was first revealed, many people revolted and felt it was wasteful, even though there was plenty of objective data showing that the process in fact increased performance and was likely to pay off even more as memory became cheaper and more plentiful.
More Windows Server tools and utilities
- Free PHP add-on brings accelerated speed, support to Windows Server
- HWiNFO utility provides free Windows hardware scans and reports
- Sysinternals Autoruns utility beefs up software debugging
The confusion over memory usage can be attributed to a number of things. One of these factors, in my opinion, is the lack of a good tool for allowing the user to see all memory allocation at a glance, topically. Various task manager applications have some overview of memory, but until now they haven't provided as detailed and useful a dissection of Windows memory usage as the RAMMap utility.
RAMMap 1.1 comes to us courtesy of Sysinternals, the folks who brought us the inimitable Process Explorer, and it's easily the best replacement out there for the stock Task Manager app. RAMMap has a far more comprehensive and specific memory-analysis page, but note that it will only work with Windows 7 or Windows Server 2008, since it requires system calls that only exist in those editions of Windows.
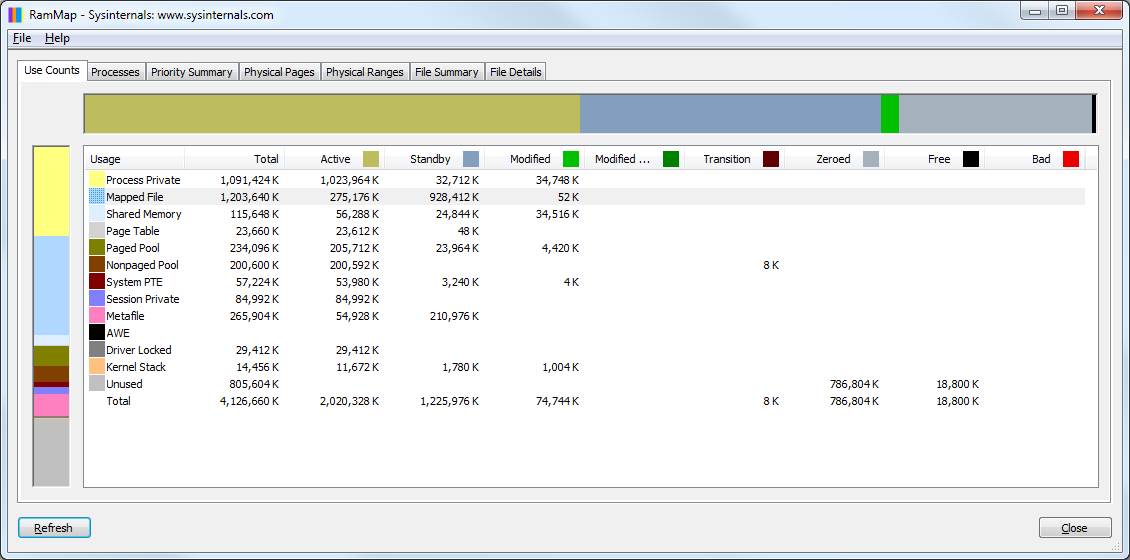
When you run RAMMap (admin privileges are required), you'll be shown a tabbed window with a default view that shows all the different ways memory is allocated -- the use counts -- in the system. This display is sliced two ways: the horizontal color bar graph shows memory by active/standby/modified/free status (there are more statuses than that, but that's the gist of it), and the vertical color bar graph shows how memory from those groups is allocated by usage. The same information is repeated in the numerical chart in the middle of the screen. Note that not all of the latter categories of memory usage are repeated in the former -- this is normal.
The other tabs provide memory-usage breakdowns via several different overviews:
- Processes – Here you'll find each running process with its corresponding private memory, standby, modified memory and page-table counts.
- Priority Summary – This tab lists memory space allocations by priority; the lower the priority count, the more likely pages from memory with that priority will be reused for a process that needs it. (This is one of several ways Windows 7 deals more efficiently with memory than, say, Windows XP.)
- Physical Pages – Here you can see which files or executables are being used by particular physical addresses in memory. You can also filter these results dynamically.
- Physical Ranges – This simply lists the blocks of physical memory available to the system. On my 4 GB 64-bit system, blocks from 0-632K, 633-3,142,988K, and 3,142,989-4,126,660K show up, with each one corresponding to different virtual address ranges: the old 640K barrier, the 3GB barrier, and everything after that.
- File Summary -- This one tabulates usage by every file currently accessed in the system. I'm not just referring to executables, either, but even things like fonts.
- File Details – Finally, the File Details tab does the same as the previous tab, but with an even more detailed breakdown of physical address ranges available for each file on demand.
Figure 1: Sysinternals RamMap (click to enlarge)
ABOUT THE AUTHOR
Serdar Yegulalp has been writing about computers and information technology for
more than 15 years for a variety of publications, including InformationWeek and Windows
Magazine.
06 Aug 2010