Troubleshoot Windows boot problems with Xbootmgr
By working with the Xperf tool, Xbootmgr helps admins pinpoint the real cause of slow boot issues in Windows Server.
Some of the toughest Windows performance problems to troubleshoot are those dealing with slow boot times.
Is the slow boot being caused by device drivers initializing, or are services taking too long to startup? Is a particular application startup delaying the boot sequence, or are numerous registry lookups causing the sluggish behavior? The answer to these questions can be revealed through the Microsoft Windows Performance Toolkit (WPT).
WPT consists of tools designed for performance analysis, including Xperf, which is used to collect Event Trace Logs (ETL) and subsequently analyze the data to produce graphs and tables. The toolkit also includes Xbootmgr, which lets admins gather boot time statistics and analyze data with Xperf.
Xbootmgr to the rescue
To begin, install the Windows Performance Toolkit. Notice that several tools will also be installed, including Xbootmgr and Xperf, located in this folder:
C:\Program Files\Microsoft Windows Performance Toolkit
From the DOS prompt, administrators can execute the Xbootmgr.exe tool to initiate a reboot and collect ETL data for later analysis. There are several command options to control the reboot and specify what data is to be collected. All of these options are thoroughly documented in the online help file, WindowsPerformanceToolkit.chm. The following is a typical Xbootmgr command:
Xbootmgr –Trace Boot –TraceFlags DIAG+DRIVERS+POWER+REGISTRY
This command will cause the server to reboot -- so be ready. After the server comes back up, it will produce an ETL file containing data for the boot process. By default, Xbootmgr will continue to collect data for 120 seconds after logon, but this can be controlled by the –PostBootDelay option. In this example, the following ETL file will be generated:
Boot_DIAG+DRIVERS+POWER+REGISTRY_1.etl
The next step is to use the Xperf tool to analyze the event trace log using this command:
Xperf Boot_DIAG+DRIVERS+POWER+REGISTRY_1.etl
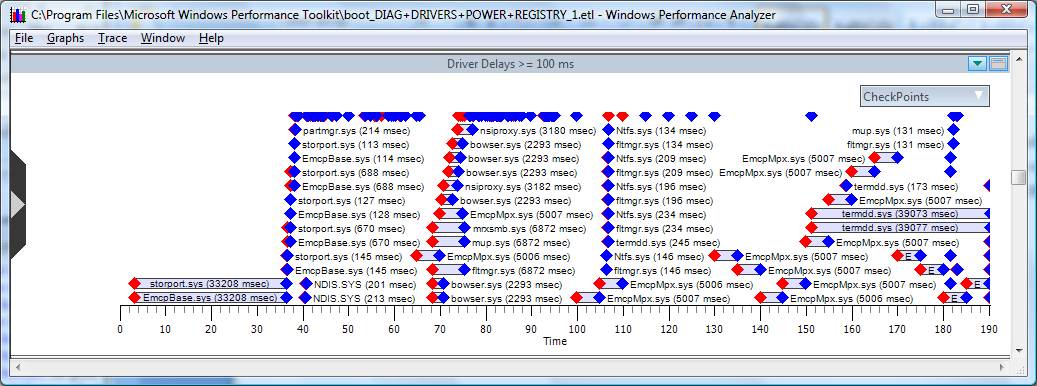
This brings up the Xperf viewer where graphs and tables can help determine why the boot process is delayed. If a newly installed device driver is causing the delays, look at the Xperf driver delays graph, which illustrates the various device drivers and their corresponding delays in milliseconds (msec). For instance, Figure 1 shows drivers such as Storport, EmcpBase and termdd.sys taking much longer than the other driver requests.
Figure 1: Xperf Driver Delays graph (click to enlarge)
Slow boot times can also be caused by lengthy service startups since a service may depend on other services to load before it can. By looking at the Xperf services graph, admins can easily pinpoint if one service is causing delays in the startup of other services.
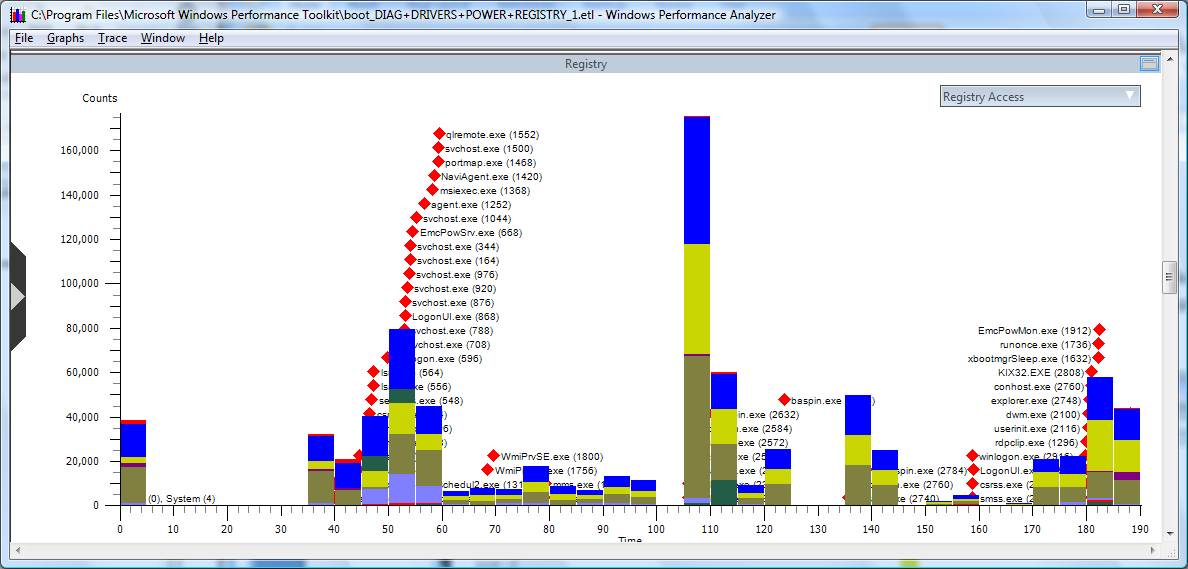
Another area that can affect the boot time during system startup is registry accesses. Some applications may lock the registry while performing updates, which can stall other applications from starting up. The Xperf registry graph displays the different types of accesses that are occurring within the registry and at what point during startup. Hovering over a particular point in the graph reveals the type of registry access.
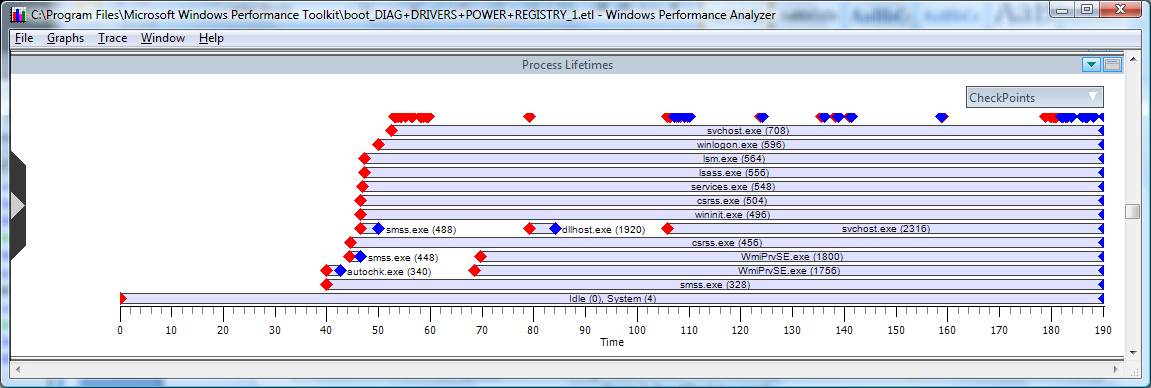
Process lifetimes can also reveal whether timely progress is being made during the boot sequence. Figure 2 shows the Xperf process lifetime graph, which illustrates when processes begin and terminate and can be used to determine if particular processes are causing delays when correlated with registry access, CPU usage or disk I/O utilization graphs.
Figure 2: Xperf Process Lifetime graph (click to enlarge)
Aside from the different analysis graphs, Xperf also enables admins to overlay one graph over another. Just right-click the graph and specify the desired graph. Figure 3 shows the registry graph overlaid with the process lifetimes graph to determine which processes are responsible for spikes in registry activity.
Figure 3: Overlay feature in Xperf (click to enlarge)
As you can see, Xperf and Xbootmgr tools can reveal significant information about what happens during the boot process. The graphs are very intuitive to decipher and can point admins in the right direction when trying to determine the cause of a slow server boot. The tools are free from Microsoft as part of the Windows Performance Toolkit.
You can follow SearchWindowsServer.com on Twitter @WindowsTT.
ABOUT THE AUTHOR
Bruce Mackenzie-Low, MCSE/MCSA is a master consultant at HP providing 3rd level worldwide support on Microsoft Windows based products including Clusters and Crash Dump Analysis. With over 25 years of computing experience at Digital, Compaq and HP, Bruce is a well known resource for resolving highly complex problems involving clusters, SAN’s, networking and internals. He has taught extensively throughout his career always leaving his audience energized with his enthusiasm for technology.