Using RamMap and VMMap Tools to Troubleshoot Windows Memory Issues
Even a veteran system admin can be challenged when investigating Windows memory issues. The free RamMap and VMMap tools remove much of the guesswork.
Troubleshooting Windows memory issues requires an in-depth understanding of the operating system along with a working knowledge of how to utilize the Windows Debugger or Performance Monitor. If you're trying to get details such as the kernel stack size or driver memory consumption, you'll need intricate experience with debugger commands and kernel data structures. Even the most veteran system administrator can be challenged when peering into a process address space to determine private versus shared memory utilization or heap size.
Fear not: RamMap and VMMap make troubleshooting memory issues easy. You can download these free tools from the Sysinternals website. Both tools were written by Mark Russinovich (writer of the Process Explorer and Notmyfault tools, and author of Windows Internals) and Bryce Cogswell.
RamMap
RamMap is used to display system and process memory statistics and utilization. It provides a summary tab called "Use Counts," which lists all the various system memory regions such as paged and nonpaged pool, process private, shareable, driver space, kernel stack, and mapped files. It also displays the amount of cache file space referred to as Metafile.
All of these regions are then further categorized into the different types of physical memory consumption such as active, standby, modified, transition, zeroed, free or bad. Each of these columns can be sorted by clicking on the column header. All of these terms are explained in Russinovich's Windows Internals book. As you can see in Figure 1, the data is neatly presented in a graphical, tabular view:
Figure 1: Use Count data in RamMap (click to enlarge)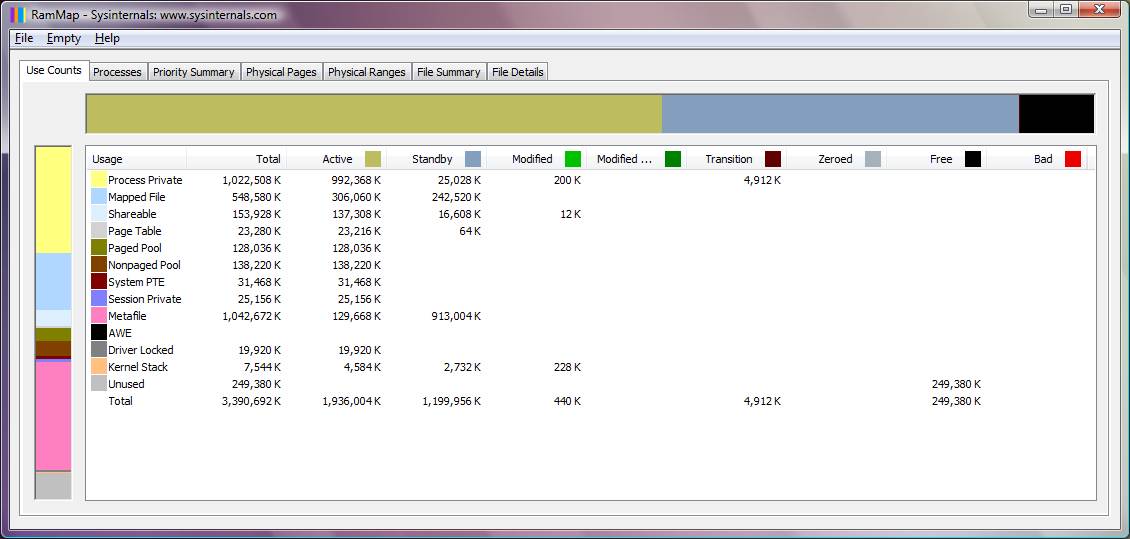
RamMap also reveals process memory utilization on the "Processes" tab. Here you will find all the processes listed, along with their corresponding private memory utilization. The data also includes any process memory that is occupying the standby or modified page list, and the amount of memory used for page table entries.
Figure 2: RamMap Processes tab (click to enlarge) 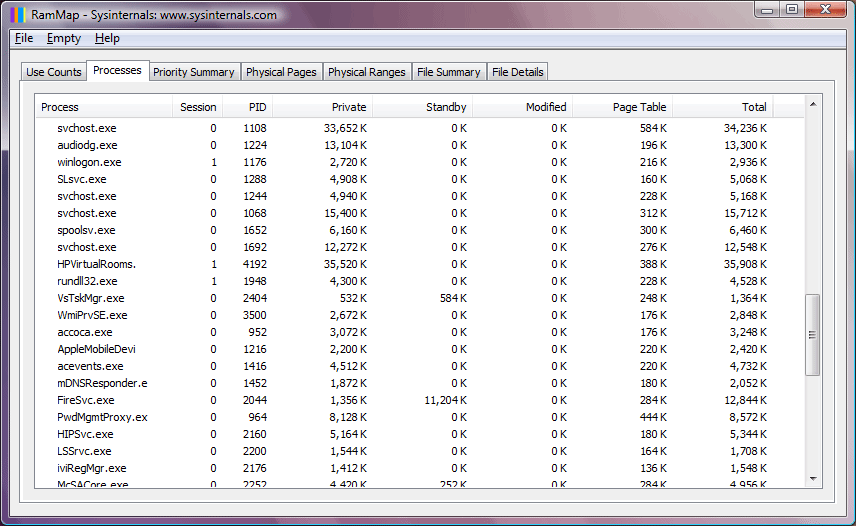
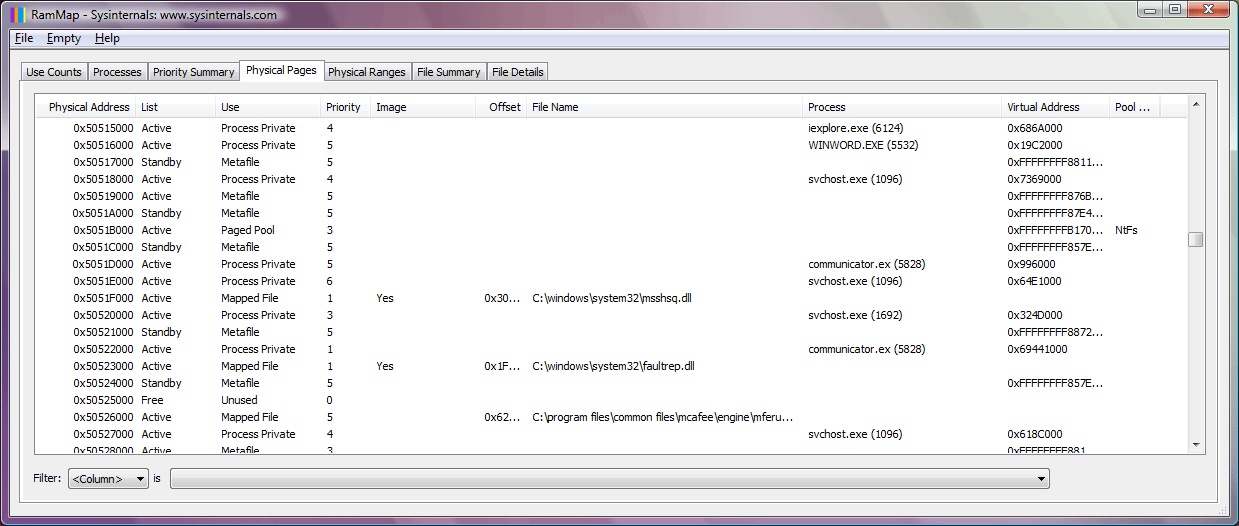
Another use for RamMap is to display the actual, physical memory usage, page by page, identifying attributes such as the memory list, use, filename, process, virtual address and pool tags. Each of these columns can be sorted and there is a filter feature which allows you to selectively analyze the data.
Figure 3: RamMap Physical Pages tab (click to enlarge)
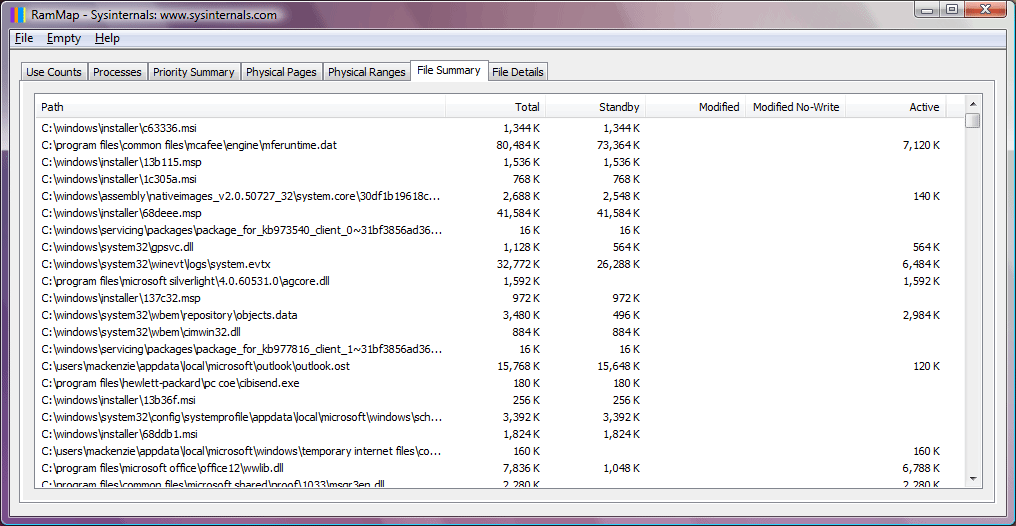
Finally, RamMap does an excellent job of revealing cached file activity and data. You can use the "File Summary" and "File Details" tabs to drill down on the system file cache to determine what is occupying the space. As seen in Figure 4, you can determine the file path, the size it is occupying, and whether the corresponding memory is on the active, standby, or modified page list.
Figure 4: RamMap File Summary tab (click to enlarge)
VMMap
Up until now, we have seen how RamMap can reveal system and process memory usage. If the memory issue you are troubleshooting appears to be related to a particular process or application, it may be necessary to take a closer look by using VMMap. VMMap is a process-oriented tool that allows you to view an existing process or trace a new one and observe its memory usage in far greater detail than RamMap.
When VMMap launches, it prompts you to select an existing process you want to investigate, or to start a new one. If you launch a new process, you will be able to trace memory utilization such as heap and virtual allocations. In Figure 5 below, I selected the communicator.exe process.
Figure 5: VMMap display (click to enlarge)
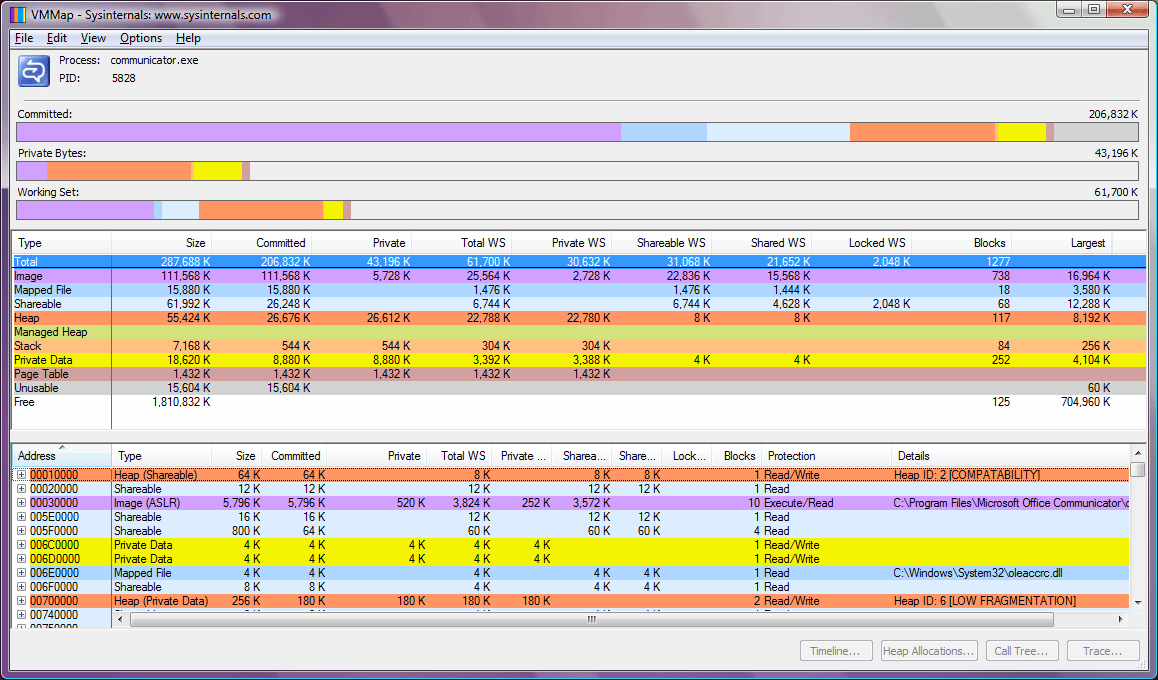
Once the main window of VMMap is displayed, you can see the screen is divided into sections. The top section is a graphical summary view of the process memory consumption. It is divided into committed space, private bytes, and the working set. In the middle portion of the screen, the memory utilization is categorized in terms of use such as private data, shareable, image, mapped files and heap size. Finally, the lower portion of the screen reveals for each virtual address what the corresponding page type is, the size, amount of working set used, page protection, any blocks, and details of the region. The color coding allows you to quickly see how much space a particular type of memory is consuming.
VMMap provides two additional views of the process address space including a "strings" view and a "fragmentation" view. The strings view allows you to search for any character readable strings that are present in the address space. The fragmentation view displays the process virtual address space in a color-coded fashion so you can see the various allocations, their size, and how contiguous they are.
You can follow searchwindowsserver on Twitter @WindowsTT
ABOUT THE AUTHOR
Bruce Mackenzie-Low is a master consultant at Hewlett-Packard providing third-level worldwide support on Microsoft Windows-based products, including clusters and crash dump analysis. He has taught extensively throughout his career always leaving his audience energized with his enthusiasm for technology.