Windows troubleshooting tools to improve VM performance
Fine-tune virtualized workloads and diagnose performance issues with help from these Windows troubleshooting tools every server administrator should know.
Whether virtualized workloads stay on premises or move to the cloud, support for those VMs remains in the data center with the administrator.
When virtualized workloads don't perform as expected, admins need to roll up their sleeves and break out the Windows troubleshooting tools. Windows has always had some level of built-in diagnostic ability, but it only goes so deep.
Admins need to stay on top of ways to analyze ailing VMs, but they also need to find ways to trim deployments to control resource use and costs for cloud workloads.
VM Fleet adds stress to your storage
VM Fleet tests the performance of your storage infrastructure by simulating virtual workloads. VM Fleet uses PowerShell to create a collection of VMs and run a stress test against the allocated storage.
This process verifies that your storage meets expectations before deploying VMs to production. VM Fleet doesn't help troubleshoot issues, but it helps confirm the existing performance specifications before you ramp up your infrastructure. After the VMs are in place, you can use VM Fleet to perform controlled tests of storage auto-tiering and other technologies designed to adjust workloads during increased storage I/O.
VM Fleet tests the performance of your storage infrastructure by simulating virtual workloads.
Sysinternals utilities offer deeper insights
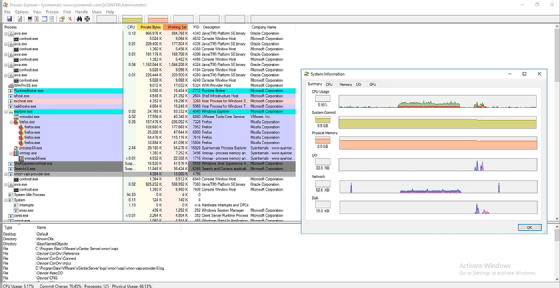
Two Windows troubleshooting tools from the Microsoft Sysinternals collection, Process Explorer and Process Monitor, should be staples for any Windows admin.
Process Explorer gives you in-depth detail, including the dynamic link library and memory mapped files loaded by a process. Process Explorer also lets you dig in deep to uncover issues rather than throwing more resources at an application and, thus, masking the underlying problem.
Process Explorer lets administrators do a technical deep dive into Windows processes that the Task Manager can't provide.
Process Monitor captures real-time data of process activity, and Registry and file system changes on Windows systems. It also provides detailed information on the process trees.
Administrators can use Process Monitor's search and filtering functions to help administrator focus on particular events that occur over a longer period of time.
VMMap and RAMMap detail the memory landscape
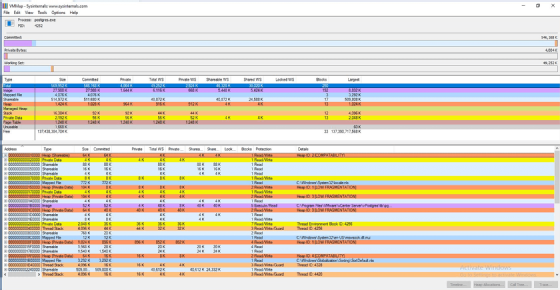
Another Sysinternals tool called VMMap shows what types of virtual memory is assigned to a process and its committed memory, which is the virtual memory reserved by the operating system. This tool shows where allocated memory is used with a visual presentation.
VMMap shows how the operating system maps physical memory and uses memory in the virtual space to help administrators analyze how applications work with memory resources.
VMMap doesn't check the hypervisor layer, but it does detail virtual memory use provided by the OS. Combined with other tools that view the hypervisor, VMMap gives a complete picture of the applications' memory usage.
Another tool called RAMMap is similar to VMMap, but it works at the operating system level rather than the process level. Administrators can use both tools to get a complete picture of how applications are getting and using the memory.
BgInfo puts pertinent information on display
BgInfo is a small Sysinternals utility that displays selected system information on the desktop, such as the machine name, IP address, patch version and storage information.
While it's not difficult to find these settings, making them more visible can help when you log into multiple VMs in a short amount of time. It's also helpful to avoid installations on the wrong VM or even rebooting the wrong VM.