Check Office 365 usage reports for user adoption insights
Microsoft gives administrators access to many Office 365 reports to pinpoint ways to improve user adoption rates and tighten up potential security leaks.
Administrators who move from Exchange Server to Exchange Online -- or the full Office 365 suite -- must learn new tools to manage these cloud services.
Many Exchange administrators spend a good amount of time managing and maintaining the messaging system, but very few monitor the overall usage of email and its components. They may inadvertently ignore low adoption rates and other issues experienced by users. Microsoft helps administrators generate a multitude of Office 365 usage reports to review and share with their teams to find ways to improve usage. These reports give the IT team access to information to address any questions or concerns around their security and end users' adoption to their managers or business leaders.
For those who might have opted to move to Exchange Online or the Office 365 suite, one of the benefits of having their email stored in Microsoft's cloud is the other services included with a subscription. A company that switches its email to Office 365 can also benefit from other cloud services, such as OneDrive, Skype for Business, Teams, SharePoint and Forms. One specific perk related to Exchange Online is administrators get visibility with usage reporting that was almost nonexistent in Exchange Server.
Office 365 usage reports bring clarity
When an organization moves its mail to an online host, many managers and leaders will want to know if their teams have adopted the new services and at what capacity. Usage reporting helps an organization determine the value of the switch to the cloud and provides insights such as:
what users need help with if they have a low adoption rate compared to other services;
the volume of email and interactions by users to see who are the biggest consumers of those workloads;
statistics on compliance to confirm users observe company policies; and
statistics on app usability across different platforms.
Interactive Microsoft Office 365 usage analytics in Power BI
One specific perk related to Exchange Online is administrators get visibility with usage reporting that was almost nonexistent in Exchange Server.
This report is available via a content pack in Power BI, which is Microsoft's data visualization and reporting platform. This feature connects directly to the cloud offering's back end, extracts the pertinent data and generates Office 365 usage reports in the form of interactive dashboards that are separated by workload, including Exchange Online, SharePoint Online, Yammer and OneDrive.
Administrators do not need to be data experts or have extensive experience with report generation. The content pack simplifies the data collection work by offering several report templates, including a product usage report for a detailed look at the user activity in each service and a communication report, which pinpoints a user's favorite service to stay in contact with.
Administrators can access the reports from mobile devices or the Power BI portal to share them with business leaders to highlight the overall adoption rate of the different Office 365 workloads.
Email activity reveals user patterns
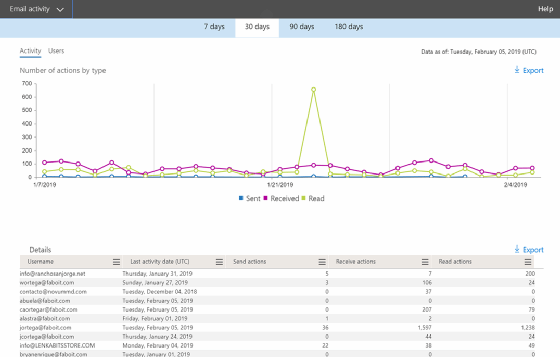
Another standard report accessible from the Office 365 admin portal is the email activity report.
Administrators can track the trends related to email on Exchange Online.
This page resides under the Reports section and shows the email volume summaries of each Exchange Online licensed user over several periods: seven, 30, 90 or 180 days. These activity reports show the amount of email read, sent and received over a particular period. If a user is receiving a lot of email but is not responding or reading much of it, it can indicate a need for additional training.
This report includes the option to export the results in a comma separated file to import into a spreadsheet for further inspection.
MyAnalytics reporting for individual email behaviors
For users who want an analysis of their work habits related to email and time management, Microsoft offers a feature called MyAnalytics, which reports on their patterns with Exchange Online. MyAnalytics measures time spent checking email throughout the day and how much focus time a user has. MyAnalytics offers suggestions on ways employees can be more efficient and productive with their time on the job to avoid burnout.
MyAnalytics reports are accessible from Office 365 Delve or can be delivered via email weekly.
Security & Compliance Center reports
One area where an Exchange administrator can never rest is security, considering most data breaches occur through a phishing attempt.
Exchange Online admins can see the threats targeting their users through the Security & Compliance Center. The reports identify the different types of attacks and potential data leaks affecting the organization. Some reports include details on the campaigns that target the leaders of the organization, spoof detection, spam detection as well as possible data leakage when sensitive information is sent outside the network. To access the dashboards, go to the Reports > Dashboard section in the Security & Compliance Center.
Administrators with some programming skills and more advanced needs can generate customized reports with the Graph API to pull raw data for more detailed information. For example, administrators can pull out granular statistics from Office 365 about the different ways users are retrieving email from Outlook, such as a Windows browser or the Android app.